- Default metrics are automatically collected for all graphs during execution
- Custom metrics are user-defined measurements that you can create to track specific behaviors or KPIs relevant to your use case
Metric Types
Runtime supports the following types of metrics, with the option to use either integer or double precision:- Counters - Track cumulative values that only increase (e.g., total interactions, errors)
- Gauges - Track current values that can go up or down (e.g., active users, response latency)
- Histograms - Track value distributions over time with automatic percentile calculations (e.g., response time percentiles)
Default Metrics
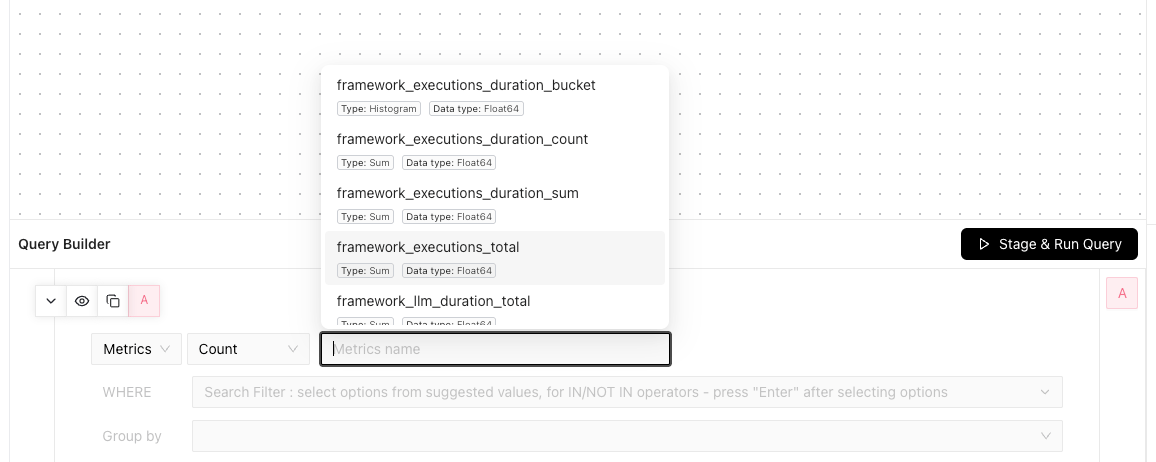
These metrics are automatically calculated when you execute your graphs.Histogram metrics appear as 3 separate metrics in the metric dropdown selector:
_bucket(distribution)_count(total observations)_sum(sum of values)
Custom Metrics
Custom metrics complement the default metrics to give you a complete picture of your application’s performance. These can include:- Engagement KPIs (e.g., session length, retention rates)
- Business metrics (e.g., in-app purchases, subscription revenue, model costs)
- User feedback tracking (e.g., thumbs up/down)
1
Initialize telemetry
2
Configure metrics
3
Record metrics
Using Metrics with Experiments
When running experiments, it’s important to track metrics to understand how different variants impact key metrics like latency or engagement. Metrics can be tracked with attributes that identify which experiment and variant they are associated with. Below is an example demonstrating how to execute a graph with user context and log relevant metrics along with the user context:- Pass user context: UserContext provides targeting information for graph execution
- Track performance by user segments: Use user attributes (tier, region) in metric tags
- Measure real latency: Track actual response times under real conditions
- Monitor errors: Record both success and failure metrics with context
Next Steps
Portal Dashboards
View and analyze your metrics with custom dashboards
Guide to experimentation
Run robust A/B experiments and optimize your metrics