

Key Features
- Performance Analysis: Measure response times and system latency to identify bottlenecks.
- Debugging & Troubleshooting: Investigate errors and refine AI graphs using trace data.
- [Coming Soon] Reusable Data: Logged traces can be used to generate evaluation datasets in automated and human review workflows.
Get Started with Traces
Capturing Traces
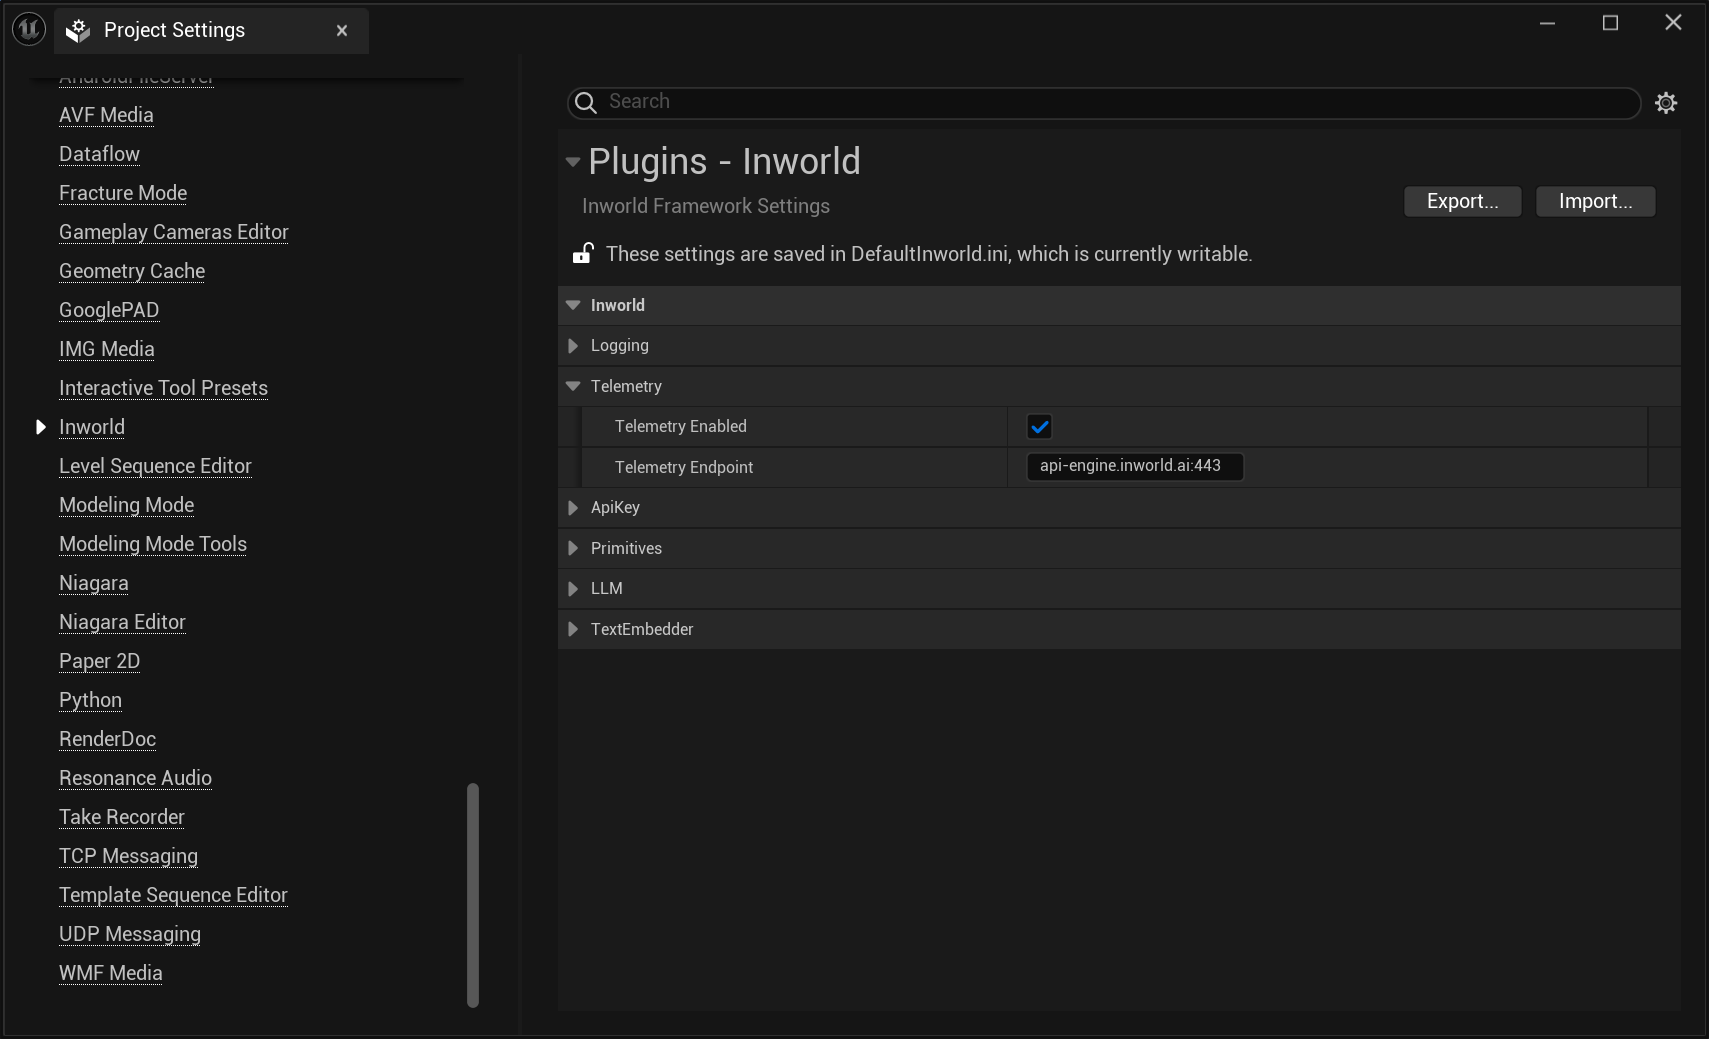
To capture traces, you’ll first need to ensure telemetry is enabled (it should be on by default). Follow the SDK specific instructions:- Node.js
- Unreal
- C++
Tracing is enabled by default. Just set your API key:Optional: Custom configurationDevelopers can customize telemetry behavior for better monitoring and performance:Why customize these settings?Programmatically in code:
appName/appVersion: Identify your app in Portal when monitoring multiple servicestracer.samplingRate: Reduce overhead in high-traffic production (default: 1.0 = capture all traces)0.1= capture 10% of trace sessions (complete execution flows)- Each captured trace still shows the full execution path
- Logs are NOT affected by trace sampling - they’re captured based on logger.level setting regardless of whether the trace is sampled
exporterType: Control where telemetry data is sentREMOTE(default): Send to Portal via HTTPS for monitoring and analysisLOCAL: Output to console/terminal for development debugging (no Portal)
First-time users: The Traces tab only appears after you have run your first graph execution. If you’ve run your first execution but still don’t see the Traces tab, please sign out and sign back in.
Viewing Traces

- Select a timeframe to view relevant traces.
- Filter by Name, Trace ID, Span ID, Application Name, or Status Code.
- Click a trace to view:
- Execution ID
- Execution latency
- Span latencies and details
- Click a span to see:
- Span ID
- Tags
- Events
- Use the search bar to find logs by Trace ID or Span ID.
- Examine logs for additional context on the particular trace or span.
Trace Metadata Definitions
Best Practices
- Enable Tracing in Development: Ensure trace logging is active in your development setup for early diagnostics.
- Use Filters for Faster Debugging: Apply filters like Execution ID and service name to quickly find issues.
- Monitor Performance Trends: Track long-term trace data to uncover inefficiencies or anomalies.
- Optimize execution: Dive deep into each trace execution to optimize each span
- Error Highlighting: Spans with errors appear with red borders for immediate identification
- Error Propagation: Dotted outlines indicate parent spans containing child spans with errors

When Should I Use Traces vs Logs?
As opposed to logs, which capture details about a specific event, traces show the flow of an entire execution. Below is an overview of some key differences:
Use traces when you need to:
- Visualize the complete flow of a request through your system
- Identify performance bottlenecks across multiple components
- Understand dependencies between different components
- Identify where failures are happening across the system (e.g., was knowledge not retrieved or did the model not utilize it?)
Next Steps
Use trace insights to continue to optimize your AI graph performance!Create Dashboards
Monitor your key metrics.
Launch an Experiment
Learn how to run an experiment to optimize your metrics.
Quickstart
Learn how to build a simple chat experience using the Node.js SDK.