

Key Features
- System Observability: Track application events and errors to ensure smooth operation and quick resolution of issues.
- Troubleshooting: Analyze logs to identify the root cause of issues by examining error messages, system state, and the sequence of events leading to the problem.
- The application that generated the logs
- Messages reported by the application
- Warnings or errors encountered during runtime
- Outputs or inputs to a specific component
Capture Logs
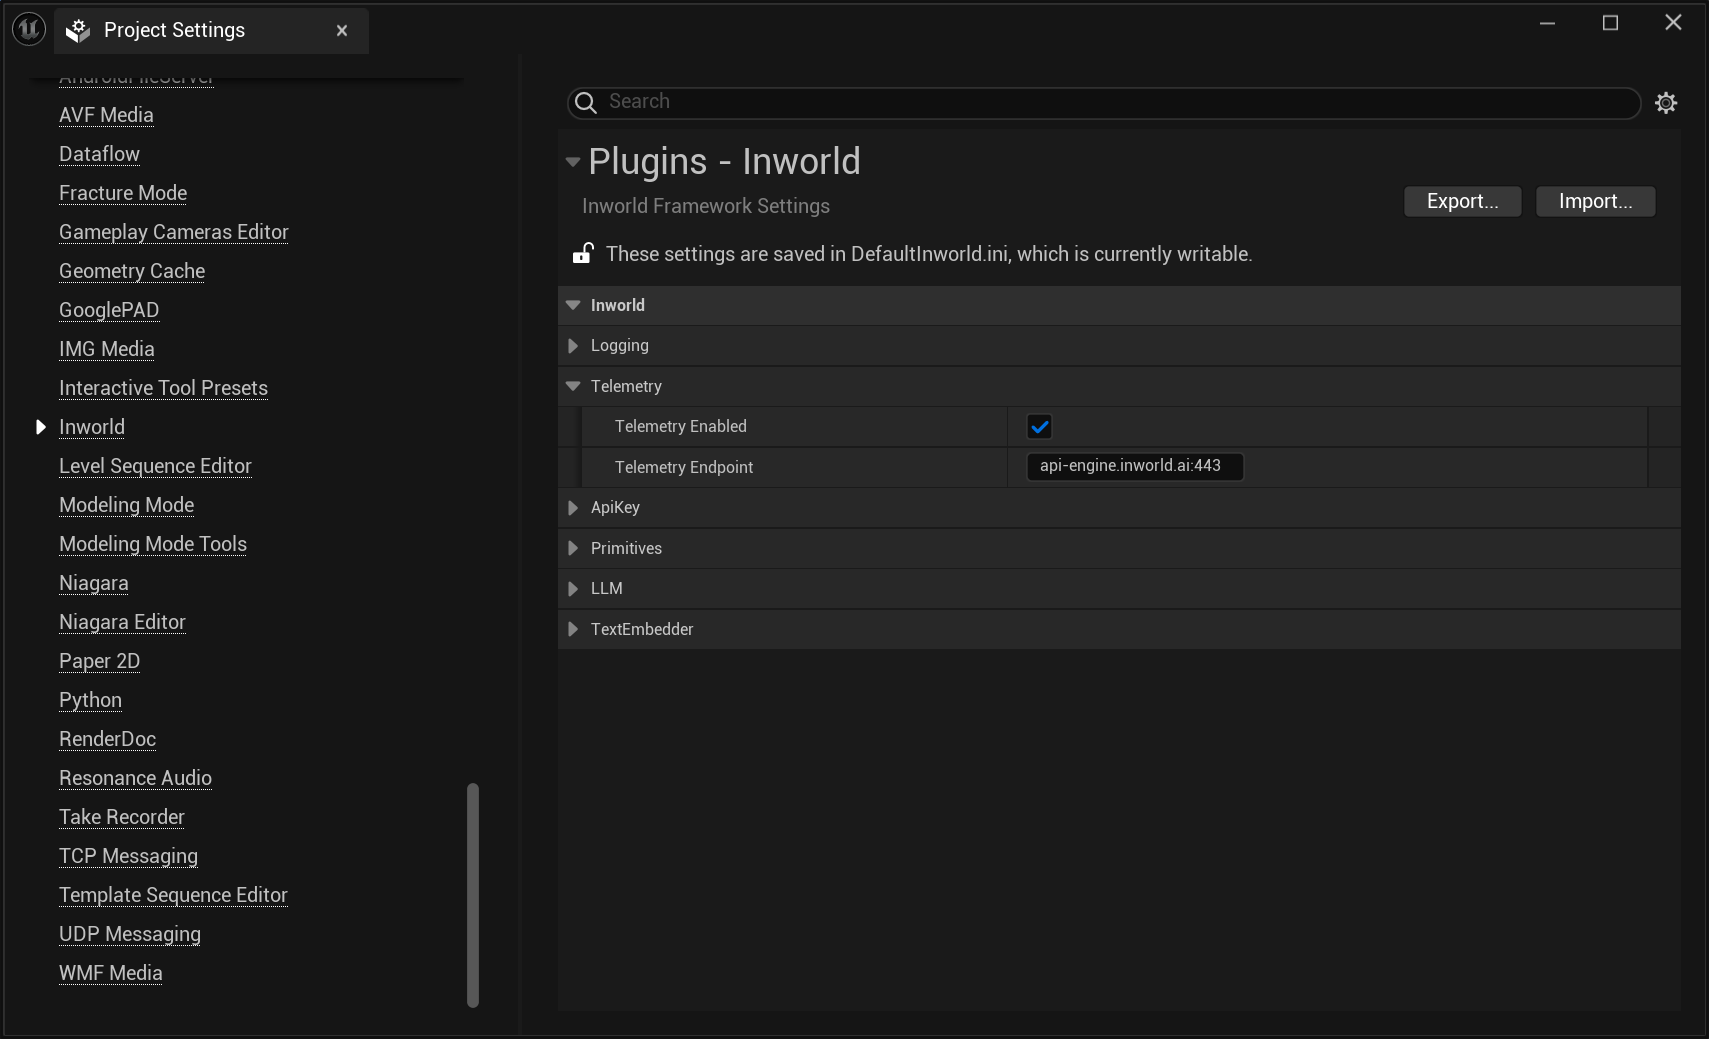
If telemetry is configured, logs are automatically generated by the Inworld Agent Runtime during graph execution and sent to Portal.Support for capturing your own custom logs in Portal is coming soon.
VERBOSITY and logger.level options.
We recommend the following set up depending on your use case:
- Default:
VERBOSITY=0+LogLevel.INFO- standard logs only - Debugging:
VERBOSITY=1+LogLevel.DEBUG- adds debug details - Max detail:
VERBOSITY=2+LogLevel.TRACE- everything
- Node.js
- Unreal
- C++
Logging is enabled by default. Just set your API key:To set the To set the
VERBOSITY:bash
logger.level:graph.ts
First-time users: The Logs tab only appears after you have run your first graph execution. If you’ve run your first execution but still don’t see the Logs tab, please sign out and sign back in.
View Logs
- Click on a log to open a side view
- Toggle between the Overview and JSON view
- Use the Filter panel to sort by severity, Service name, Variant, and Graph ID
- Use the Search bar to filter logs by keywords or IDs.
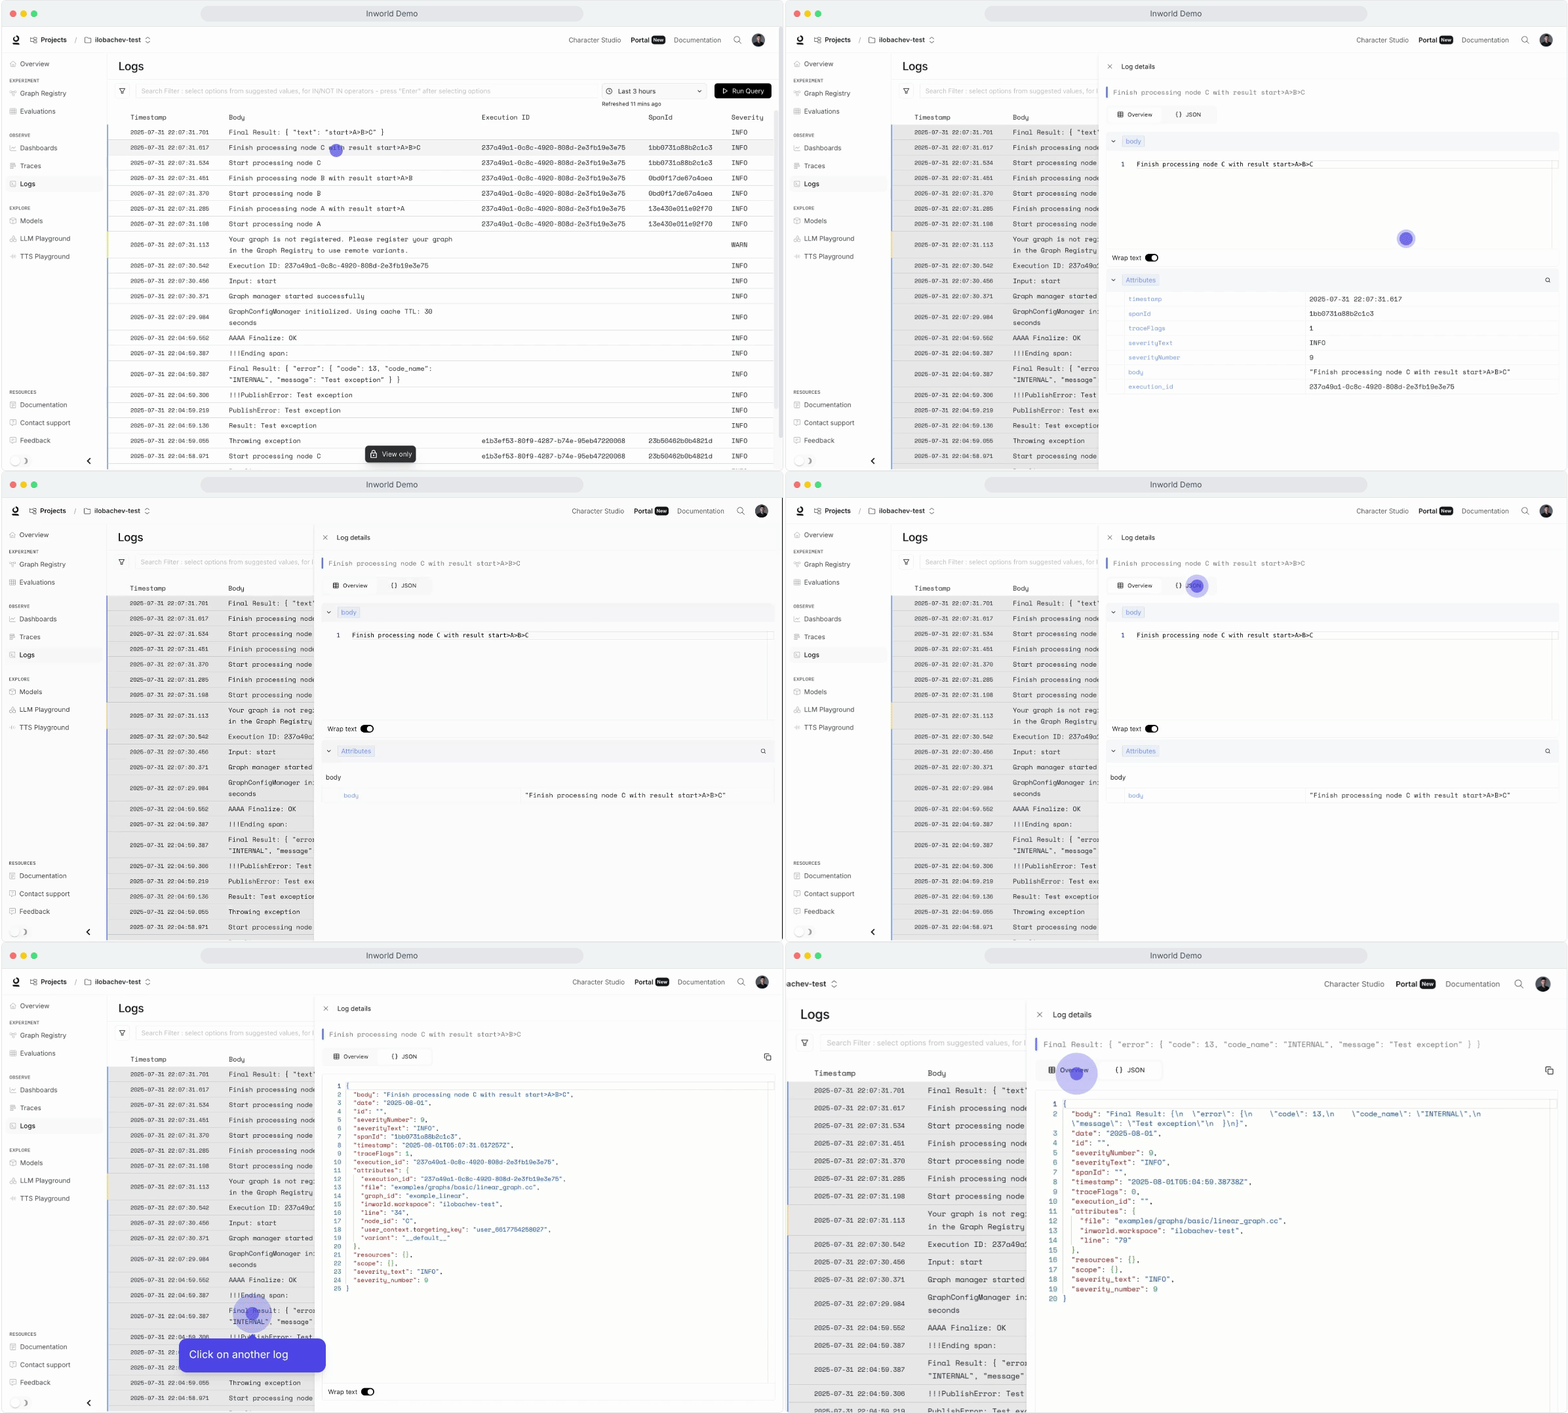
Log Metadata Definitions
When Should I Use Logs vs Traces?
As opposed to traces, which shows the flow of a single execution, logs can be used to capture details about specific events, including detailed metadata unique to that event. Below is an overview of some key differences:
Use logs when you need to:
- Debug failure cases or unexpected behavior
- Track specific metrics or state changes
- Capture intermediate values within nodes (beyond inputs/outputs)
Next Steps
View Traces
View end-to-end graph executions to help with debugging and analysis.
Create Dashboards
Monitor your key metrics.
Quickstart
Learn how to build a simple chat experience using the Node.js SDK.